Loading the feed…
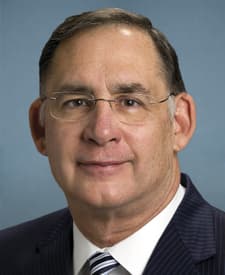
Senate · AR · Republican
John Boozman
166 trades across 80 tickers, a mix of buys and sells.
22 filings · traded Mar 19, 2025 – Sep 25, 2026
Trades over time
By trade date
Bought · above the axis · 81Sold · below · 85size = bracket floor$1k$15k$250k$1M
Each mark is one trade, placed on the trade date the filing printed; marks stack where trades collide. Size is the bracket floor — the least the disclosed range allows — not the amount traded. 31 trades past the stack height are counted as “+N” at the end of their column rather than drawn. Select a mark to open the ticker.
Bracket Interval
Disclosed volume range
The band is the full range these disclosures permit; the tick is the midpoint estimate. Members report brackets, so the true figure lies somewhere in the band.
Post-trade performance
Track record
After the trade
−0.5 pts
vs S&P 500 · 90 trading days · rank 12 of 16
After disclosure
−0.9 pts
+0.4 pts lost to the disclosure delay
Hit rate
40%
of 40 decisions · 8 filings
Luck check
—
of same-date random picks beaten
Score: average move vs the S&P 500 in points, shrunk toward zero for small samples. Both clocks use the same decisions.
Best-timedover 90 trading days
Decisions not measured: no price series (1).
How each stock moved after this member traded it, against the S&P 500 (SPY) over the same trading days, read the way the trade pointed — the stock’s move, not their profit. No dollar amount enters it. Not advice, and not evidence of wrongdoing. How to read the track record.
Legislative Assignments
Committees
Current Congress · 6 committees
- Commission on Security and Cooperation in Europemajority · rank 2· for the Senate
- Senate Committee on Agriculture, Nutrition, and ForestryChairmanmajority · rank 1
- Commodities, Derivatives, Risk Management, and TradeEx Officiomajority · rank 7
- Conservation, Forestry, Natural Resources, and BiotechnologyEx Officiomajority · rank 7
- Food and Nutrition, Specialty Crops, Organics, and ResearchEx Officiomajority · rank 7
- Livestock, Dairy, Poultry, and Food SafetyEx Officiomajority · rank 7
- Rural Development, Energy, and CreditEx Officiomajority · rank 7
- Senate Committee on Appropriationsmajority · rank 6
- Department of Defensemajority · rank 6
- Departments of Labor, Health and Human Services, and Education, and Related Agenciesmajority · rank 5
- Financial Services and General Governmentmajority · rank 2
- Military Construction, Veterans Affairs, and Related AgenciesChairmanmajority · rank 1
- State, Foreign Operations, and Related Programsmajority · rank 3
- Transportation, Housing and Urban Development, and Related Agenciesmajority · rank 3
- Senate Committee on Environment and Public Worksmajority · rank 8
- Clean Air, Climate, and Nuclear Innovation and Safetymajority · rank 6
- Fisheries, Water, and Wildlifemajority · rank 5
- Transportation and Infrastructuremajority · rank 7
- Senate Committee on Rules and Administrationmajority · rank 9
- Senate Committee on Veterans' Affairsmajority · rank 2
Top Symbols
Most traded by volume
- IEIiShares 3-7 Year Treasury Bo$183k
- XFIVBondBloxx Bloomberg Five Yea$91k
- IEFiShares 7-10 Year Treasury B$65k
- SPYMTradr 2X Long SPY Monthly ET$56k
- XTWOBondBloxx Bloomberg Two Year$49k
- SHYiShares 1-3 Year Treasury Bo$41k
- CMBSiShares CMBS ETF$40k
- JMBSJanus Henderson Mortgage-Bac$40k
- MBBiShares MBS ETF$40k
- VEAVanguard Developed Markets I$40k
- BBEUJPMorgan BetaBuilders Europe$33k
- WWSYXWestwood Quality SmallCap Fu$33k


Estimated from disclosure brackets. Assets without a ticker — Treasuries, funds — appear in the trade list below.
Direction Split
Buy / sell by ticker


Complete Ledger
Every disclosed trade
166 trades, newest first
Industry Exposure
By sector
Trade count · disclosed range
The range is what the brackets in that sector disclose; a group with an open-ended bracket shows a floor only.
How to read this
Industry groups fold EDGAR’s SIC code for each issuer into twelve sectors. 108 of 166 trades are unclassified: assets with no ticker (Treasuries, funds), ETF trusts and other issuers EDGAR lists no SIC for, or symbols the fill has not reached yet.