Loading the feed…
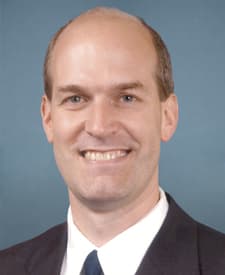
House · WA-2 · Democrat
Rick Larsen
25 trades across 23 tickers, a mix of buys and sells.
4 filings · traded Jan 7, 2026 – Oct 8, 2026
Trades over time
By trade date
Bought · above the axis · 11Sold · below · 12Exchange / other · on the axis · 2size = bracket floor$1k$15k$250k$1M
Bracket Interval
Disclosed volume range
The band is the full range these disclosures permit; the tick is the midpoint estimate. Members report brackets, so the true figure lies somewhere in the band.
Post-trade performance
Track record
Not enough matured trades yet
Measured over 90 trading days: 2 of 3 filings needed to be ranked (18 decisions over 30 days, ranked #9 of 24); 8 more waiting for the horizon to pass.
Decisions not measured: not a stock or ETF (1).
How each stock moved after this member traded it, against the S&P 500 (SPY) over the same trading days, read the way the trade pointed — the stock’s move, not their profit. No dollar amount enters it. Not advice, and not evidence of wrongdoing. How to read the track record.
Legislative Assignments
Committees
Current Congress · 1 committee
- House Committee on Transportation and InfrastructureRanking Memberminority · rank 1
Top Symbols
Most traded by volume
- SNDASonida Senior Living, Inc.$16k
- ABTAbbott Laboratories$8,001
- ADIAnalog Devices, Inc.$8,001
- APHAmphenol Corporation$8,001
- AWKAmerican Water Works Company$8,001
- AXPAmerican Express Company$8,001
- BRBroadridge Financial Solutio$8,001
- CARRCarrier Global Corporation$8,001
- CASYCaseys General Stores, Inc.$8,001
- DRIDarden Restaurants, Inc.$8,001
- ESSEssex Property Trust, Inc.$8,001
- FDXFedEx Corporation$8,001


Estimated from disclosure brackets. Assets without a ticker — Treasuries, funds — appear in the trade list below.
Direction Split
Buy / sell by ticker
BoughtSoldtrades, by direction

Complete Ledger
Every disclosed trade
25 trades, newest first
Industry Exposure
By sector
Trade count · disclosed range
The range is what the brackets in that sector disclose; a group with an open-ended bracket shows a floor only.
How to read this
Industry groups fold EDGAR’s SIC code for each issuer into twelve sectors. 1 of 25 trades are unclassified: assets with no ticker (Treasuries, funds), ETF trusts and other issuers EDGAR lists no SIC for, or symbols the fill has not reached yet.


